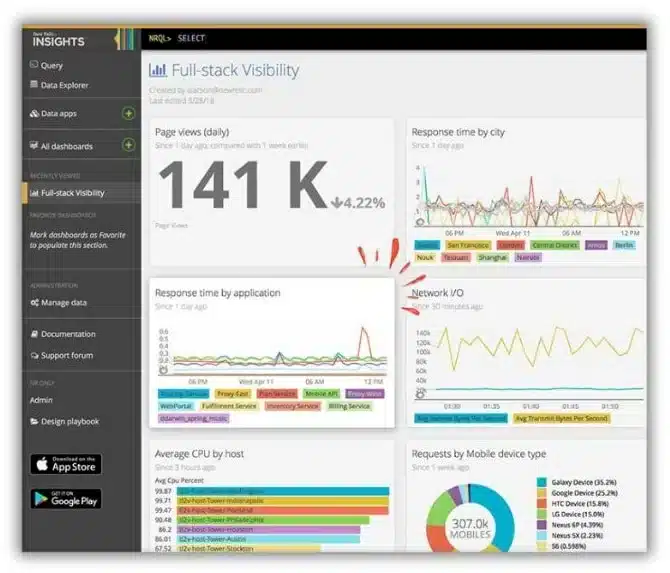
New Relic APM is the most popular cloud-based software that offers online software solutions for websites. It is synthetic monitoring of the performance of apps. You can easily track the health of apps while giving the main concern to new updates for them. You can easily check any type of anomaly in the health of your app.

Image: SoftMany
Working Process of Synthetic Monitoring In New Relic
As we mentioned above, Monitors are available in several forms, and you can select any according to your device. Synthetic monitoring can easily be started to work in New Relic, you need to follow the given steps;
1. Synthetic monitors work as APIs for checking the websites in detail, capturing combined numbers, detailed statistics of failures and page resources, and collecting the custom response codes.
2. Avail Synthetic monitors without installation. For this purpose, you need to create a New Relic account by going to the official website one.newrelic.com.
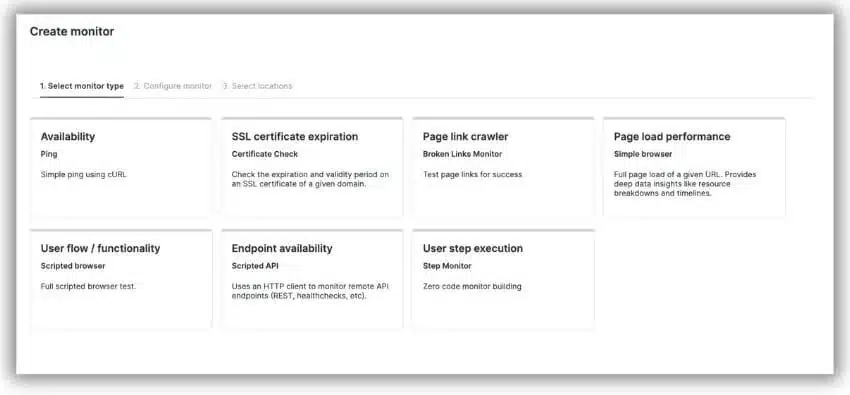
3. Go to Synthetic monitoring, and click on Create a monitor. option, and select your preferred monitor. Ping and Step monitors are the best options.?
Synthetic Monitoring In New Relic Working Process
How to get Synthetics Monitoring to work in a new relic? You can create Synthetic monitoring with the help of any of the given below;
API Test Monitor
- Log in to your newly created New Relic account, and click on the Add New option at the top right corner to select the Synthetic option.
- Go to the monitor type option to select API Test, and input the name of the monitor.
- Open Monitoring Locations? for selecting the location.
- Next, you need to set the schedule and frequency for monitoring.
- The setting of notifications to email IDs with the help of a new alert policy option. For this purpose, open Add to an existing alert policy. for selecting the existing policy. You will find three types of policies.
- The policy is for one open incident at a time for the alert policy.
- By Condition offers one open incident at a time per alert condition.
- By Condition & entity offers an incident each time a condition is debased.
- Click on write your script and the script will be written automatically.
- Finally, click on the Create monitor option and all is done.
Ping Monitor
Here we are going to discuss the second most popular form of monitor, the Ping Monitor. You need to follow the given steps to create a monitor.
- Log in to your newly created New Relic account, and click on the Add New option at the top right corner to select the Synthetic option.
- Input the URL along with the response corresponding URL.
- Select a location from the Monitoring Location option.
- It is time to set the Schedule and frequency i.e. 10 minutes as frequency will run the monitor for a specific time.
- Set Notification to email IDs while selecting an option from Add new existing alert policy by inserting the email address and policy name.
- After selecting Policy Alert, finally, click on the Create option and the Ping Monitor will be created.
Summary Page
After creating your Synthetic monitor, open Summery Page from the top right corner, to click on Synthetic Monitor to check, if any failure issue alert is available, click it, and it will redirect you to a new window. You can also get access to Alert Policies by clicking on Manage policies for all monitors.
Monitor Generated Results
Next, you can watch the result pages, and easily sort out any unusual results. You can filter them location-wise for comparing the monitor performance. For this purpose you need to follow the given steps;
- Go to the New Relic and next click on Synthetic.
- Select your monitor by clicking on the Monitor Tab.
- Next, click on the Monitor option, and then next on Results.
Resource Load-time
From the Results option, you are capable of watch your detailed report about all parts of your website, as it has a specific impact on the overall load including images, HTML, CSS, JavaScript, etc. collect your detailed metrics from the runtime, locate performance info for a time used by third-party resources, and detect HTTP response codes for every resource. You need to follow the given steps;
- Open your New Relic account, and go for Synthetics.
- Click the Monitors option, and select Monitor from the drop-down menu.
- Click on Monitor, and next on Resources.
Moreover, some additional configuration options for a ping or simple browser monitor are also possible such as;
- Validation String offers substring monitoring for response validation.
- Custom Headers are accompanied by submitted requests offered by the monitors.
- Verify SSL is for validating the SSL certificate chain.
In case of returning of non-zero exit code, the monitor fails to run. It is advised to select the setup for ping monitors only;
- Use the Bypass request option to skip the default HEAD request and use the GET verb.
- Redirect Failure categorizes the redirect as a failure, and advises to follow the new URL.
- Custom Headers are added for submitting requests from monitors.
You are capable of configuring device emulation settings of simple browsers, as it is including device type and screen orientation.
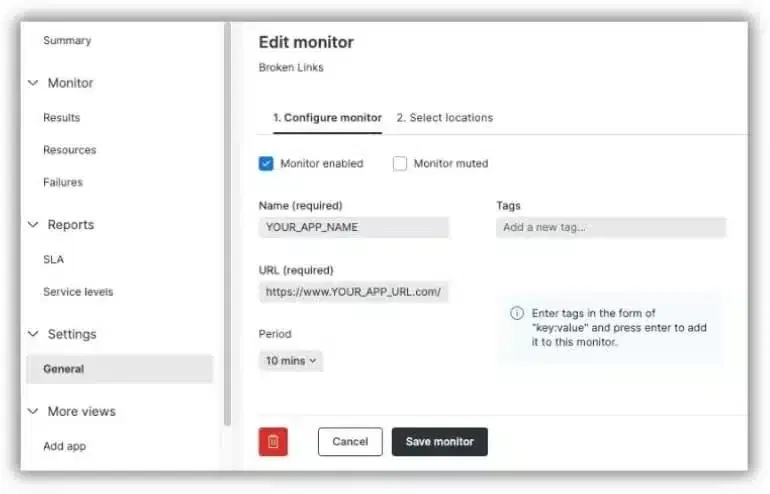
Edit a Monitor
After creating a monitor, it is not possible to change its type. Anyhow, it can be edited easily using the Settings option.
- open your best fast browser.
- Go to one.newrelic.com, and click on Synthetic monitoring.
- Select the monitor you want to edit, and click it.
- Change the given changes by selecting the link from the side menu.
- Click on Settings, and go to the General option for editing name, URL, location, frequency, and other advanced options.
- Select Settings, and next Script in the scripted browser and API test monitor, and edit the monitor script.
- Click on the Manage Alerts option to edit synthetic monitoring alerts.
- Click on the Save Changes option, and confirm your editing process.
Delete a Monitor
In case of not satisfied with the created monitor, you can delete it, but it demands Admin privileges from you. To delete the monitor, you need to log in to your New Relic account and select monitor for editing. Click on the Delete button from the General option. All is done within a few seconds.
Techniques of Monitoring
We have two main techniques for monitoring the performance and health of our applications; Real-User Monitoring and Synthetic Monitoring.
Real User Monitoring
Real User Monitoring or RUM is based on a passive monitoring technology for analyzing the interaction between all users of the website. It is integrated with a cloud-based app or server. It tracks down the position of users to a positive side while checking the workflow, whether is it running error-free, or creating any problems.
Synthetic Monitoring
Synthetic Monitoring works as a prediction tool or a monitoring technique to inform us about any failing process in our system. It uses scripted recordings of transactions to send alerts i.e. spikes in memory usage, spikes in response time, etc. The alerts enable you to get information about anomalies in the health of the app, and any unusual happening in your system. It is a simple procedure to monitor performance while providing centralized services to solve low-level events such as;
- Auto-tracking of performance and deployment of functionality by adding synthetic monitoring into build automation and CI/CD pipelines.
- Connect availability and performance of endpoints to get reasons for failures of underlying apps.
- Offers expanded monitoring process with real, Selenium-powered scripted browsers, to enable you to test login procedures, searches, business transactions, etc.
- Detects any type of uprooting issue in the network or AWS location, slow resource of third party, or health of apps, and infrastructure.
- Offers API tests for monitoring the API endpoints.
Types of Synthetic Monitors
Synthetic monitoring has four main types;
Ping Monitor
It is a simple type of synthetic monitor, and it is used for checking online applications. It sends requests to your sites using a Java HTTP client.
API Test
Check your API endpoints with the help of an API test monitor. It clears the working position of servers corresponding to websites. New Relic makes HTTP calls to API endpoints while using the HTTP request module for validating the results.
Browser
Basically, the simplest and pre-built scripted browser monitors for making requests to the website with the help of Google Chrome.
Script Browser
These are more sophisticated and customized. You can use them for navigating to a website, and performing specific tasks while giving assurance of the presence of resources.
Why do we Need Synthetic Monitoring?
Diagnose and fix Failures
It monitors the APIs, websites, web, mobile, and SAAS applications, no matter, if your system is running in a low-traffic period. It also offers emulation of user interactions while running them from international locations or from any local firewall. It alerts the operation team about any performance degradation or availability problem, so the team members can easily understand it, and fix them before they start doing any miss-functionality.
Baseline & Benchmark
Constant checking of APIs and applications based on frequency and location is possible. It can baseline the performance of your application to detect areas where improvements are required. It also enables the users to benchmark the performance and availability of apps to gain success against competitors.
Navigate to a New Market
It enables the users to check the area with low traffic such as campaigning of a new market. You can easily simulate traffic to the required area of the app for ensured availability and performance. In addition, check the performance of the newly launched app in a new location.
Manage you’re Business Transactions
It is not limited to only monitoring the uptime and availability of APIs and apps, as the emulation of business processes or transactions including login, search, form filling, and adding of items to a cart is also possible with it. Compare the performance stats between locations and steps in the transactions for formulating the plans to improve the performance.
Measuring SLAs
You need multiple service level agreements to manipulate a modern business with the help of SLA, no matter on what side you are. It is the best option for both client and vendor parties. It is quite helpful for vendors to manage the availability and performance limitations in a better way.
Manage Third-party Vendors
Third parties are the main source to offer functionality and data to modern apps. The third parties are integrated with CDNs, payment processes, site searching, recommended plugins, business intelligence, and analytics solutions. Synthetic monitoring enables the third-party owners to check all related components including service level objectives, performance degradations, and unavailability incidents while holding the vendors accountable.
Check End User Perception
The real browser level is the point where all the dynamic parts of apps bet together, and you are capable of measuring the true end-user experience. As the monitors run from several locations and browsers using real ISPs and devices and offer insight into responsive time components, and end-user experience metrics including page load, DOM load, first paint, etc.
Concluding
All-in-all, Synthetic monitoring or Synthetic testing enables you to monitor the availability and performance of your applications. It alerts you about any failure or error before the time to manage on time.
FAQs
Synthetic monitoring is proactive monitoring for expanding the browser monitoring that is empowered by real and Selenium-powered scripted browsers. It helps you to test login procedures, searches, and business transactions.?
Log in to your New Relic account, click on Synthetic monitoring, and select monitor from the index you want to delete, click on the Delete option from the ellipsis icon.?
It includes three main types
1. Availability monitoring
2. Web performance monitoring
3. Transaction monitoring